Melbourne truck operators are moving about 6% more boxes per trip than they were four years ago. 31,000 fewer truck trips carrying 71,500 more TEU.
The published landside performance metric recorded that as the terminals getting better.
The ACCC defines container turnaround time as truck turnaround time divided by containers per truck, and its own footnote says the number can fall "if trucks carry more containers and stevedores service the trucks at the same rate". So it improves if a terminal speeds up, and it improves if you go and buy a bigger trailer. Same result either way, and nothing on the face of it tells you which.
Victoria publishes all three columns every month by terminal, so you can actually check. Take the published truck turnaround, divide by the published containers per truck, and the headline figure comes back exactly. Every month, 198 months straight.† It's not a model, it's their own arithmetic.
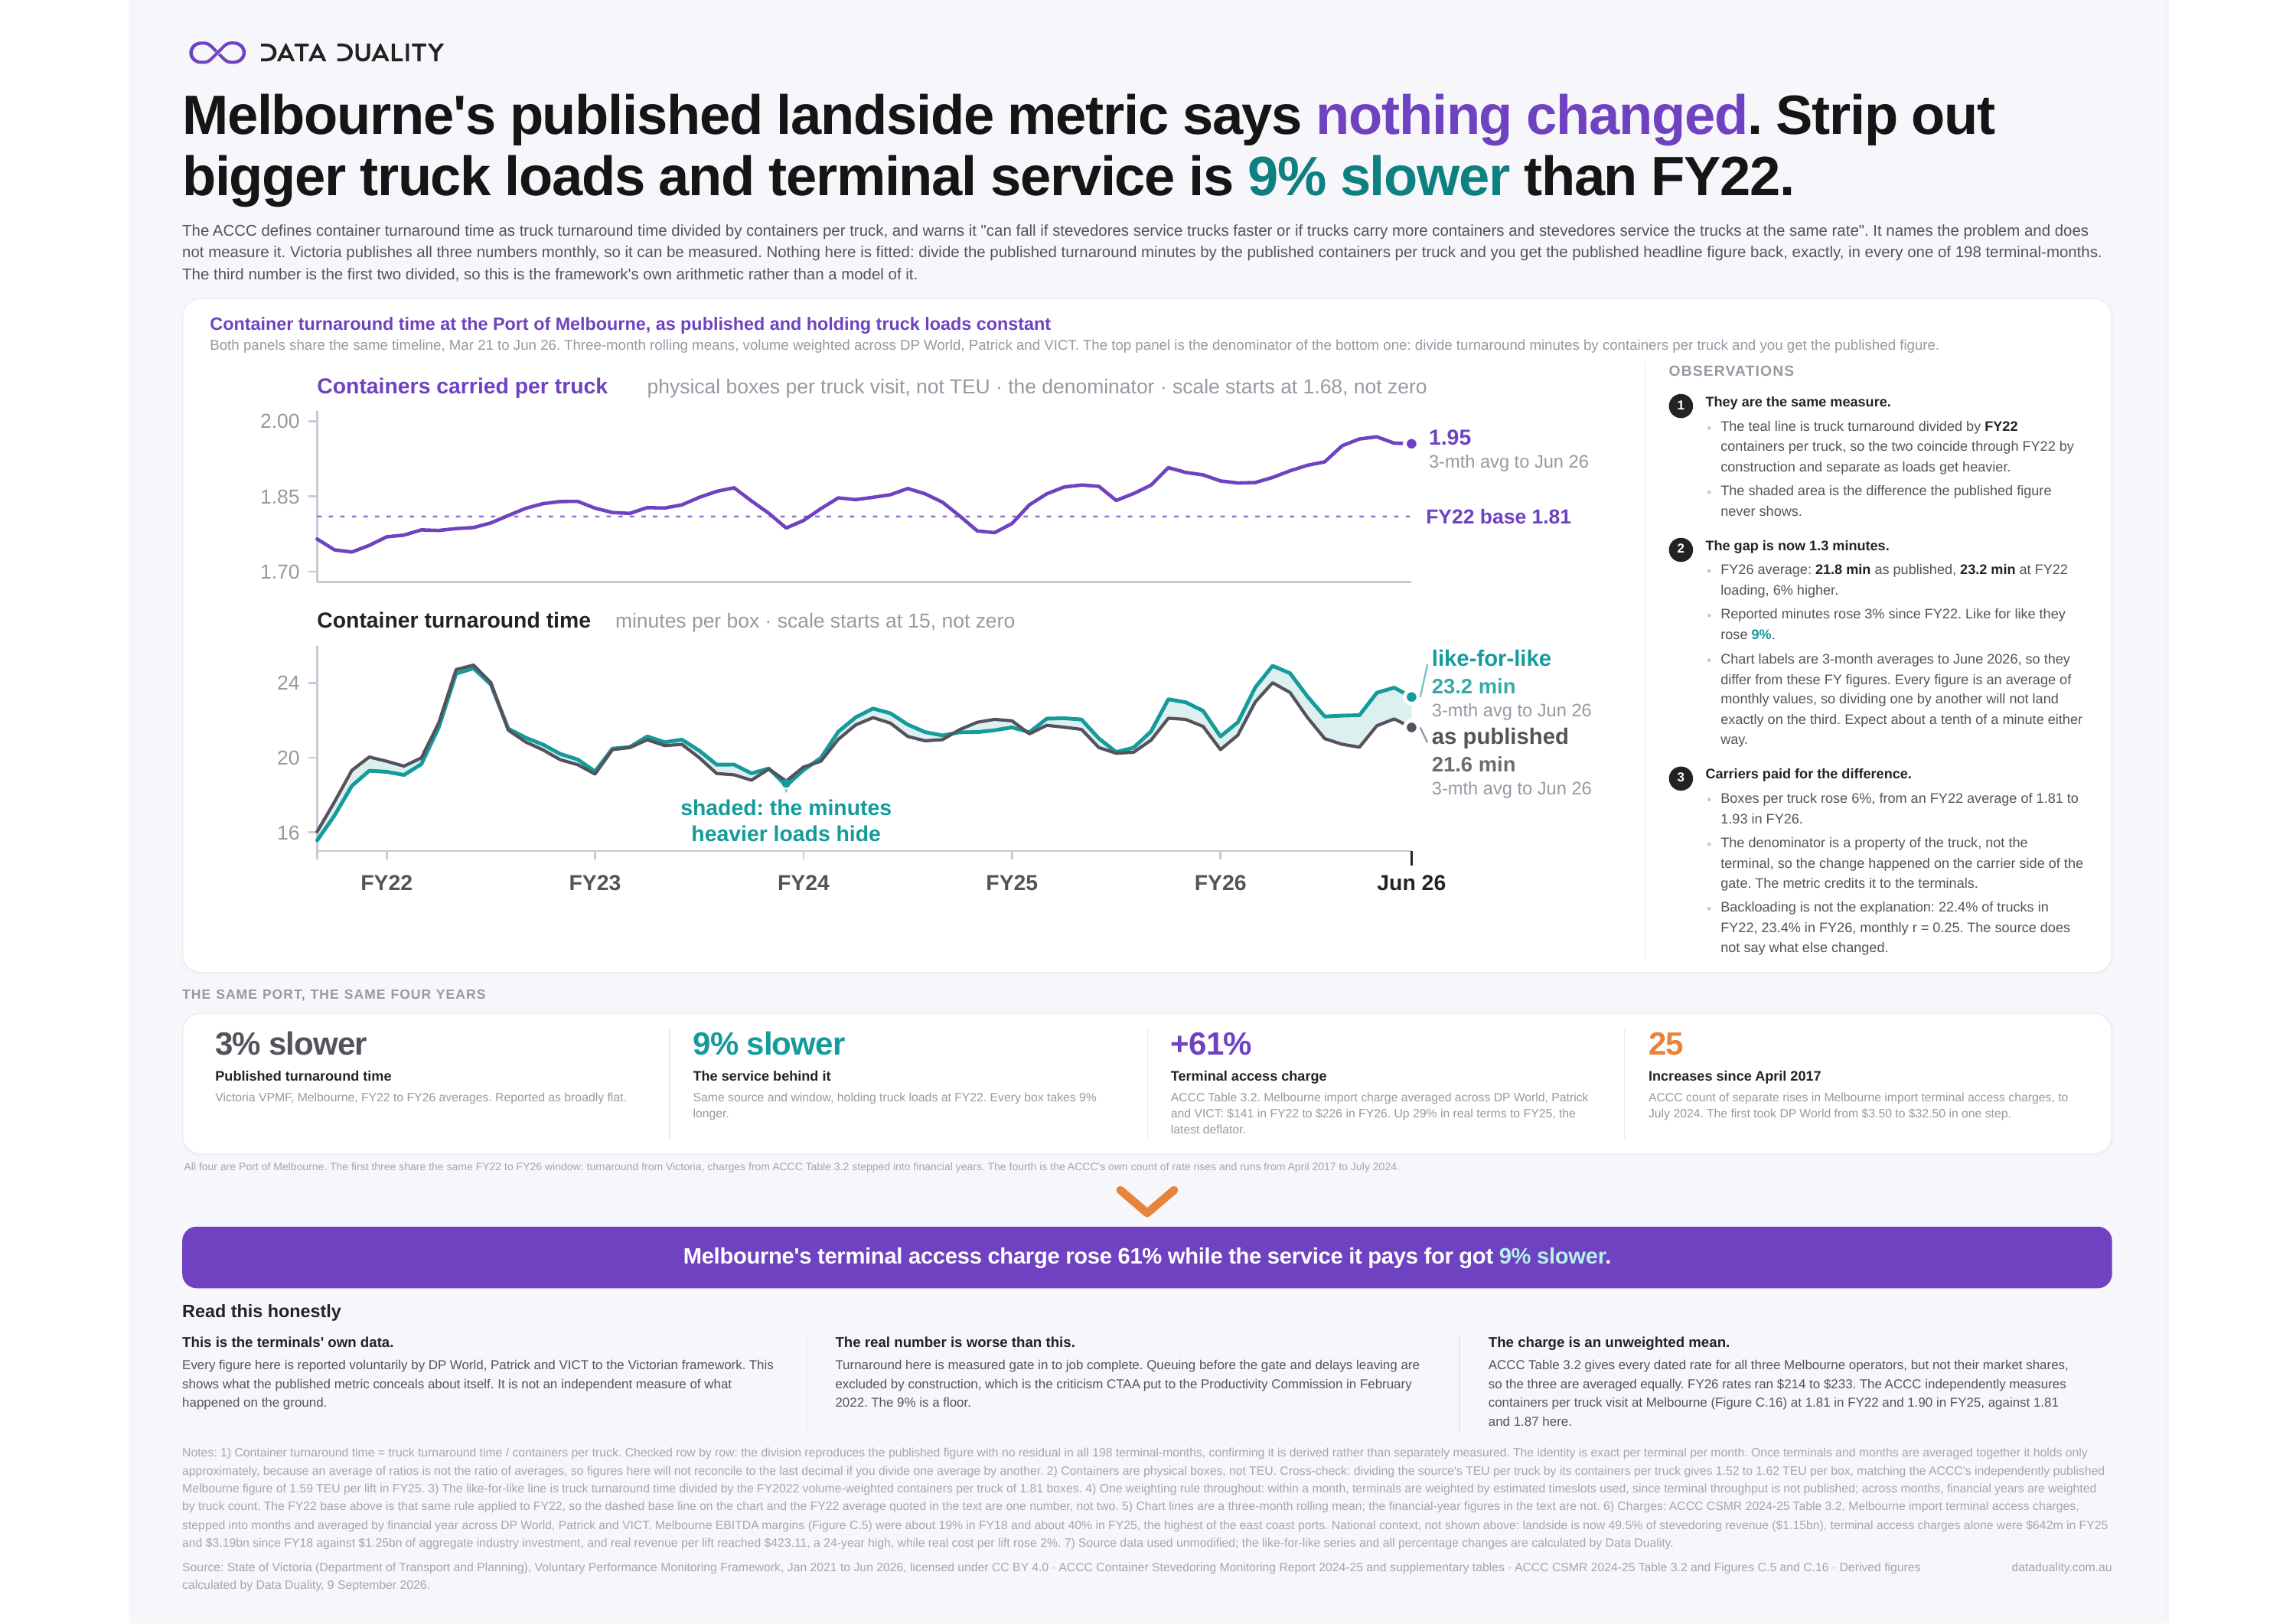
Since FY22 the published number at Melbourne has barely moved. Compare like with like, same number of boxes on the truck as FY22, and the time to move one is 9% worse.* Terminal access charges over those same four years went from $141 to $226 a container.
Working is in the attached slide with the sources, so pull it apart if you want to.
And if I've got something wrong I'd rather hear it. I put a correction up on my own numbers a few weeks back and I'll do it again.
† 198 terminal-months: 66 months across DP World, Patrick and VICT. See note 1.
The same port, the same four years
- 3% slower. Published turnaround time. Victoria VPMF, Melbourne, FY22 to FY26 averages. Reported as broadly flat.
- 9% slower. The service behind it. Same source and window, holding truck loads at FY22. Every box takes 9% longer.*
- +61%. Terminal access charge. ACCC Table 3.2. Melbourne import charge averaged across DP World, Patrick and VICT: $141 in FY22 to $226 in FY26. Up 29% in real terms to FY25, the latest deflator.
- 25. Increases since April 2017. ACCC count of separate rises in Melbourne import terminal access charges, to July 2024. The first took DP World from $3.50 to $32.50 in one step.
* Assumes a lighter truck would take the same time. See the assumption behind the 9%.
Melbourne's terminal access charge rose 61% while the service it pays for got 9% slower.
 (opens the chart full screen)
Tap to zoom
Observations
- They are the same measure. The teal line is truck turnaround divided by FY22 containers per truck, so the two coincide through FY22 by construction and separate as loads get heavier. The shaded area is the difference the published figure never shows.
- The gap is now 1.3 minutes. FY26 average: 21.8 min as published, 23.2 min at FY22 loading, 6% higher. Reported minutes rose 3% since FY22. Like for like they rose 9%.
- Carriers paid for the difference. Boxes per truck rose 6%, from an FY22 average of 1.81 to 1.93 in FY26. The denominator is a property of the truck, not the terminal, so the change happened on the carrier side of the gate. The metric credits it to the terminals. Backloading is not the explanation: 22.4% of trucks in FY22, 23.4% in FY26, monthly r = 0.25. The source does not say what else changed.
Read this honestly
This is the terminals' own data. Every figure here is reported voluntarily by DP World, Patrick and VICT to the Victorian framework. This shows what the published metric conceals about itself. It is not an independent measure of what happened on the ground.
The real number is worse than this. Turnaround here is measured gate in to job complete. Queuing before the gate and delays leaving are excluded by construction, which is the criticism CTAA put to the Productivity Commission in February 2022. The 9% is a floor.
The charge is an unweighted mean. ACCC Table 3.2 gives every dated rate for all three Melbourne operators, but not their market shares, so the three are averaged equally. FY26 rates ran $214 to $233. The ACCC independently measures containers per truck visit at Melbourne (Figure C.16) at 1.81 in FY22 and 1.90 in FY25, against 1.81 and 1.87 here.
*The assumption behind the 9%. The like-for-like line holds truck loads at FY22, which assumes a truck carrying fewer boxes would spend the same time at the terminal. In practice part of every visit is lifting boxes, so a lighter truck would be somewhat quicker, and the like-for-like change per box sits somewhere between the published 3% and 9%. Two things pull in opposite directions: lighter loads would bring the figure down from 9%, while the queuing outside the gate that this data leaves out would push the real wait up. On the terminals' own numbers, each truck visit takes about 9% longer than in FY22.
Notes: 1) Container turnaround time = truck turnaround time / containers per truck. Checked row by row: the division reproduces the published figure with no residual in all 198 terminal-months, confirming it is derived rather than separately measured. The identity is exact per terminal per month. Once terminals and months are averaged together it holds only approximately, because an average of ratios is not the ratio of averages, so figures here will not reconcile to the last decimal if you divide one average by another. 2) Containers are physical boxes, not TEU. Cross-check: dividing the source's TEU per truck by its containers per truck gives 1.52 to 1.62 TEU per box, matching the ACCC's independently published Melbourne figure of 1.59 TEU per lift in FY25. 3) The like-for-like line is truck turnaround time divided by the FY2022 volume-weighted containers per truck of 1.81 boxes. 4) One weighting rule throughout: within a month, terminals are weighted by estimated timeslots used, since terminal throughput is not published; across months, financial years are weighted by truck count. The FY22 base above is that same rule applied to FY22, so the dashed base line on the chart and the FY22 average quoted in the text are one number, not two. 5) Chart lines are a three-month rolling mean; the financial-year figures in the text are not. 6) Charges: ACCC CSMR 2024-25 Table 3.2, Melbourne import terminal access charges, stepped into months and averaged by financial year across DP World, Patrick and VICT. Melbourne EBITDA margins (Figure C.5) were about 19% in FY18 and about 40% in FY25, the highest of the east coast ports. National context, not shown above: landside is now 49.5% of stevedoring revenue ($1.15bn), terminal access charges alone were $642m in FY25 and $3.19bn since FY18 against $1.25bn of aggregate industry investment, and real revenue per lift reached $423.11, a 24-year high, while real cost per lift rose 2%. 7) Source data used unmodified; the like-for-like series and all percentage changes are calculated by Data Duality.
Source: State of Victoria (Department of Transport and Planning), Voluntary Performance Monitoring Framework, Jan 2021 to Jun 2026, licensed under CC BY 4.0 · ACCC Container Stevedoring Monitoring Report 2024-25 and supplementary tables · ACCC CSMR 2024-25 Table 3.2 and Figures C.5 and C.16 · Derived figures calculated by Data Duality, 9 September 2026.